The idea: two sine waves drive one pen
A Lissajous figure is the path of a point whose x and y both swing like sine waves, each at its own pace:
x(t) = sin(a·t + δ) y(t) = sin(b·t) t from 0 to 2πa and b are the two frequencies (how many waves each makes while t goes from 0 to 2π) and δ is the phase: how far the x wave is ahead of the y wave. The page draws the x wave under the figure with time running down and the y wave beside it with time running right. At any time t the pen takes its x from the blue wave and its y from the green one; the grey links show this.
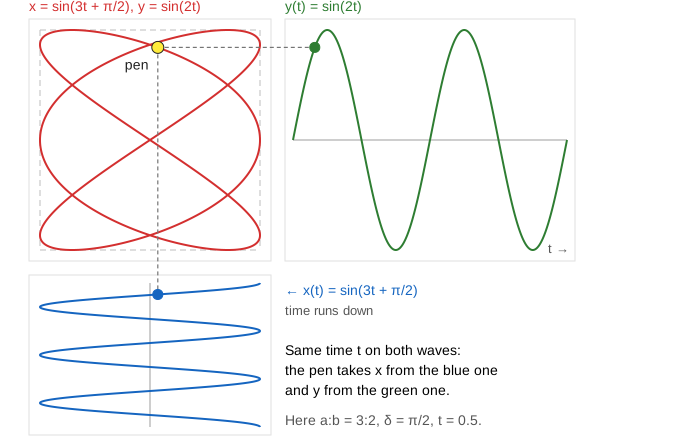
This is what an oscilloscope in XY mode shows: one signal moves the beam sideways, the other moves it up and down. Engineers used it to compare two frequencies or to see the phase between them long before digital meters. (Demo: draw 3:2 with the pen.)
1:1: the phase alone sets the shape
With a = b = 1 both waves have the same frequency and only δ differs:
| δ | x(t) | the figure |
|---|---|---|
| 0 | sin t, the same as y | the line y = x |
| between 0 and π/2 | a little ahead of y | an ellipse leaning like y = x |
| π/2 | sin(t + π/2) = cos t | a circle: x = cos t, y = sin t |
| between π/2 and π | almost opposite to y | an ellipse leaning like y = −x |
| π | −sin t | the line y = −x |
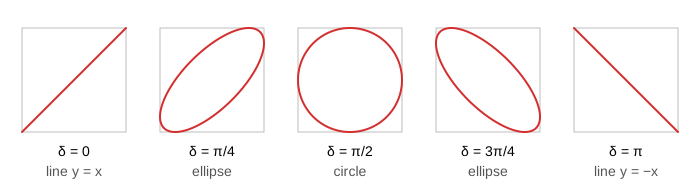
This is how an oscilloscope measures a phase shift: feed it a signal and the same signal after a circuit, and the tilt and fatness of the ellipse give δ. The circle at δ = π/2 is the unit circle itself. (Demo: 1:1, δ from 0 to π.)
Reading a:b off the picture
y = sin(b·t) reaches 1 exactly b times while t goes from 0 to 2π, and −1 another b times. Each time, the pen is on the top (or bottom) edge of the square. In the same way x reaches ±1 a times each, at the left and right edges. So:
touches on top = touches on the bottom = b touches on the right = touches on the left = aCount the touches on the top and on one side and you have the ratio: a:b = side touches : top touches. Turn touches on to see them as teal (top, bottom) and orange (sides) dots. (Demo: count the touches: 3:4.) Swapping a and b turns the figure on its side, so 2:1 is 1:2 lying down.
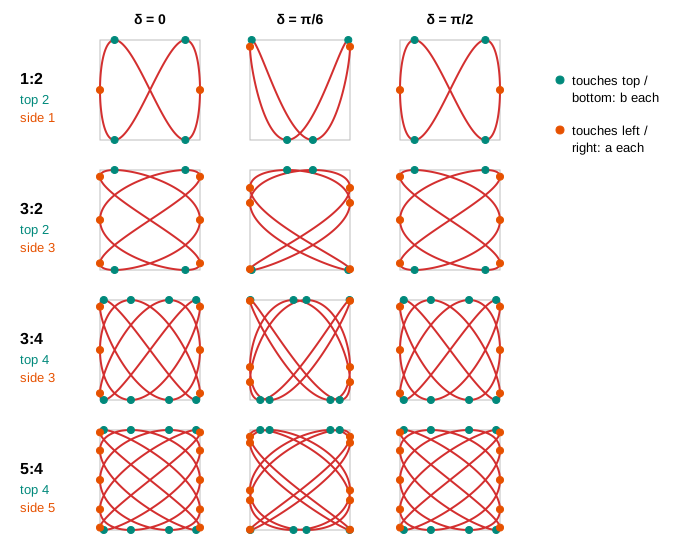
A closed figure with whole, coprime a and b crosses itself 2ab − a − b times when it is not folded (1 for the figure eight 1:2, 7 for 3:2, 17 for 3:4). The shape also repeats as δ grows: moving t on by 2π/b leaves y the same and adds 2πa/b to the x phase, so δ only matters up to a multiple of 2π/b. For 5:4 that makes δ = 0 and δ = π/2 the same picture.
Closed or not
If a and b are whole numbers, after t = 2π both waves are back where they started, so the pen is too and the figure closes. If the ratio is a fraction with big numbers, like 21:20, it still closes, but only after 20 laps of y, and the 20 laps fill the box. If a:b is not a fraction at all, like √2:1, the two waves never get back in step: the pen never returns to its start and, given time, passes as close as you like to every point of the square. (Demo: √2:1 never closes and fills the box.)
Why it seems to turn in 3D
Sweeping δ makes the figure look like a wire shape turning in space: a line becomes an ellipse and then a circle, just as a hoop seen edge-on and then face-on would. (Demo: 1:2, δ from 0 to π: a figure eight that seems to spin.)
A ratio close to 1:1 does the sweep by itself. Write 21t as 20t + t:
x = sin(21t + δ) = sin(20t + (δ + t)) y = sin(20t)Over one lap of y (t grows by 2π/20) this is a 1:1 figure with phase δ + t, and every lap the phase is 2π/20 bigger. So each lap is the next frame of a 1:1 phase sweep, and the ellipse seems to rotate. On an oscilloscope this is what two almost equal frequencies look like; the slower the turning, the closer the frequencies. (Demo: 21:20 drifts.)
When the curve folds back
For some values of δ the pen runs along an arc and back along the same path, so the closed loop collapses into an open curve with two ends at the edges. It happens when 2bδ/π − b + a is an even whole number:
| a:b | δ | curve |
|---|---|---|
| 1:1 | 0, π | the lines y = x, y = −x |
| 1:2 | π/4, 3π/4 | the parabolas y = 2x² − 1 and y = 1 − 2x² |
| 2:1 | π/2 | the parabola x = 1 − 2y² |
| 1:3 | 0 | the cubic y = 3x − 4x³ |
These are the Chebyshev polynomials: sin 3t = 3 sin t − 4 sin³ t gives the cubic and cos 2t = 1 − 2 sin² t gives the parabola. The parabola is the middle of the 1:2 sweep, between two figure eights.
A folded curve passes each touch point twice (there and back), so the touch count can drop: the parabola y = 2x² − 1 touches the top at its two ends, in the corners, but the bottom only once, at its vertex.
The ABC logo
The Australian Broadcasting Corporation's logo is the Lissajous figure a = 1, b = 3, δ = π/2: x = cos t, y = sin 3t, one touch on each side and three on top. It was taken from an oscilloscope picture. (Demo: the ABC logo.)
Two sine waves added along one line instead of plotted against each other are on Sine Waves: What a, b, c, d Do and Fourier Series. A pen moved by two turning circles instead of two swings draws a Spirograph; curves drawn by an angle instead of time are on Polar Coordinates and Rose Curves.
Add friction and a slight detune to the two waves and the figure spirals inward and slowly turns: see Harmonograph: a Pen Driven by Damped Pendulums.
What the page leaves out
Different amplitudes A·sin and B·sin (they only stretch the box into a rectangle), damped waves (the harmonograph, whose figures spiral inwards), a phase on the y wave too (only the difference matters), δ beyond π, ratios other than the ones in the menu, Lissajous knots in 3D, and how the curve is used to place sampling points (Padua points). The figure for √2:1 is drawn for t up to 20π only.