The idea: a curve made of nothing but lerps
A Bézier curve is drawn from a few control points P0, P1, … Pn. It starts at P0, ends at Pn and bends toward the points in between without passing through them. Every point of the curve comes from one operation, linear interpolation: lerp(P, Q, t) = (1 − t)·P + t·Q, the point that is a fraction t of the way from P to Q. de Casteljau's algorithm applies it over and over.
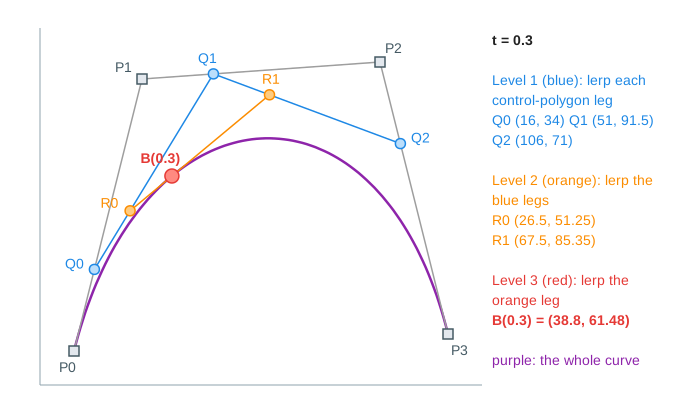
Level by level
Fix a value of t between 0 and 1. Lerp every leg of the control polygon at that t: a cubic has 3 legs, so you get 3 new points (Q0, Q1, Q2). They form a polygon with one leg fewer. Lerp its legs at the same t (R0, R1), and again, until one point is left. That point is B(t). A curve of degree n needs n levels and n(n+1)/2 lerps.
| Curve | Control points | Levels | At t = 0.3 |
|---|---|---|---|
| Linear | P0 (10, 10), P1 (110, 80) | 1 | B = (40, 31) |
| Quadratic | P0 (10, 10), P1 (60, 95), P2 (120, 20) | 2 | B = (40.9, 46.6) |
| Cubic | P0 (10, 10), P1 (30, 90), P2 (100, 95), P3 (120, 15) | 3 | B = (38.8, 61.48) |
A linear Bézier curve is just the segment from P0 to P1 (Demo: linear lerp at t = 0.3). A quadratic is a lerp of two lerps (Demo: quadratic at t = 0.3), and a cubic adds one more level (Demo: cubic at t = 0.3). The panel on the right lists every lerp with its coordinates.
Sweeping t traces the curve
Run de Casteljau again for t = 0, 0.05, 0.1, … 1 and keep only the last point each time. The whole scaffold slides along the legs and the last point draws the curve, one bead per value of t (Demo: trace the cubic, then its hull). At t = 0 every lerp sits on the first point of its leg, so the curve starts at P0; at t = 1 it ends at Pn. The curve leaves P0 in the direction of P1 and arrives at Pn from the direction of Pn−1, which is why the inner points act as handles in drawing programs.
Bernstein weights
Expanding the lerps gives one formula: B(t) = Σ bi,n(t)·Pi, with the Bernstein polynomials bi,n(t) = C(n, i)·ti·(1 − t)n−i. For a cubic they are (1−t)³, 3t(1−t)², 3t²(1−t) and t³. At t = 0.3 they are 0.343, 0.441, 0.189 and 0.027, and 0.343·P0 + 0.441·P1 + 0.189·P2 + 0.027·P3 is the same (38.8, 61.48) that the lerps gave. The bars on the right show the weights for the current t.
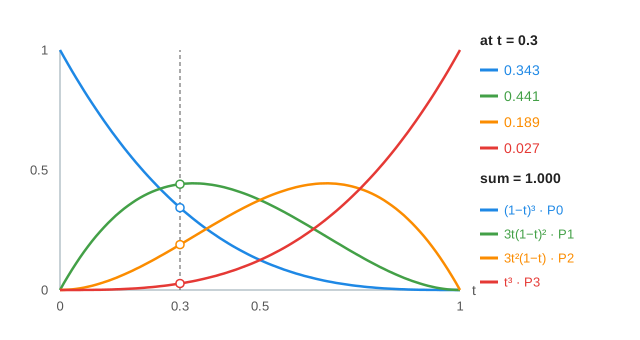
de Casteljau is the way to compute the curve in practice: it uses only additions and multiplications by t and 1 − t, so it stays accurate, while the expanded power form loses precision for high degrees.
The convex hull property
Because the weights are ≥ 0 and sum to 1, every point B(t) is a convex combination (a weighted average) of the control points. So the whole curve lies inside the convex hull of its control points, the smallest convex polygon around them (Convex hull button). Graphics code uses this as a cheap test: if two hulls do not overlap, the two curves cannot cross, and if the hull is off screen, the curve is too. The same reasoning gives affine invariance: to rotate, scale or move a curve, transform its control points and redraw.
Splitting at t
One de Casteljau run at t gives more than a point. The first point of every level (P0, Q0, R0, B(t)) is the control polygon of the curve from 0 to t, and the last point of every level (B(t), R1, Q2, P3) is the control polygon of the curve from t to 1 (Demo: split the cubic at t = 0.5). At t = 0.5 the left half is P0 (10, 10), Q0 (20, 50), R0 (42.5, 71.25), B (65, 72.5), and the right half is B (65, 72.5), R1 (87.5, 73.75), Q2 (110, 55), P3 (120, 15).
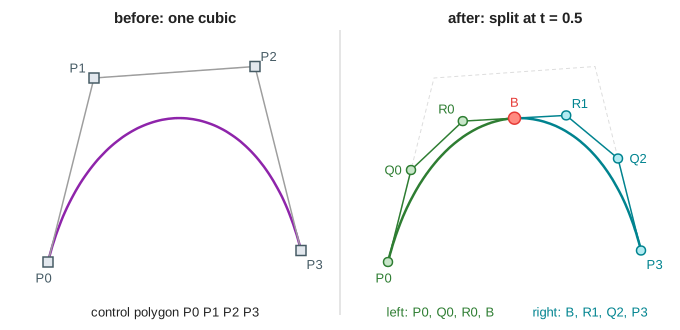
Each split cuts the gap between the control polygon and the curve roughly by a factor of 4, so a few rounds of splitting make each piece flat enough to draw as a straight line. That is how renderers draw curves and how curve intersection is computed.
Curves in fonts and SVG paths
Real shapes are many pieces joined end to end. TrueType fonts use quadratic pieces; PostScript, CFF fonts, SVG C commands and the HTML canvas bezierCurveTo use cubics. The S-curve demo joins two cubics at P3. Because P2, P3 and P4 lie on one straight line, both pieces leave P3 in the same direction and the join has no corner (G1 continuity). Each piece keeps its own convex hull (Demo: S-curve (a font-glyph path)).
See also Rotation and Scaling (2D) for the transforms you apply to the control points, and Convex Hull for how the hull itself is computed.
Once a curve or surface is cut into triangles, Rasterization turns them into pixels.
What the page leaves out
Rational Bézier curves (with weights, which can draw exact circles), B-splines and NURBS, curves of degree above 3, surfaces, arc-length parameterization (equal steps in t are not equal steps along the curve, as the uneven bead spacing shows), and adaptive flattening are not drawn. Control points are fixed; the page does not let you drag them.