The idea: a sine wave trapped in a heart
This function went around the internet as "the heart graph":
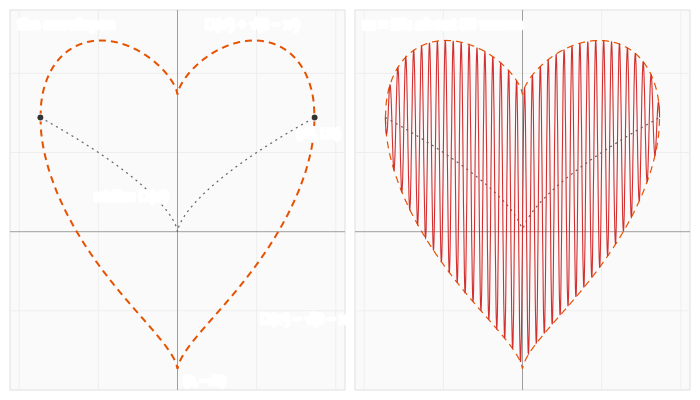
f(x) = ∛(x²) + √(3 − x²) · sin(mπx) −√3 ≤ x ≤ √3For small m it is a wobbly V. Make m bigger and the curve swings faster and faster, until it fills a heart shape. The heart is already hidden in the formula: it is the pair of envelope curves y = ∛(x²) ± √(3 − x²), and the curve can never leave them.
Three pieces
| piece | what it does |
|---|---|
| ∛(x²) = x^(2/3) | the midline: a V with a sharp cusp at (0, 0), the same on both sides |
| √(3 − x²) | the amplitude: √3 ≈ 1.73 in the middle, 0 at x = ±√3 (the top half of a circle of radius √3) |
| sin(mπx) | the swing: between −1 and 1, m sets how fast |
The square root needs 3 − x² ≥ 0, so the domain is −√3 ≤ x ≤ √3 (about ±1.732). At both ends the amplitude is 0, so every curve, whatever m is, ends at (±√3, ∛3) ≈ (±1.73, 1.44).
Why the curve stays inside the heart
A sine is never bigger than 1 or smaller than −1. Multiply that by the amplitude and add the midline:
∛(x²) − √(3 − x²) ≤ f(x) ≤ ∛(x²) + √(3 − x²)These two bounds are the dashed orange curves on the canvas. They do not contain m, so they stay put while m changes. The upper one has a dip at x = 0 (the cusp of ∛(x²) lifted by √3) and the lower one has its lowest point there, at y = −√3. That is the heart: two bumps on top, a point at the bottom, and the two curves meeting at the ends.
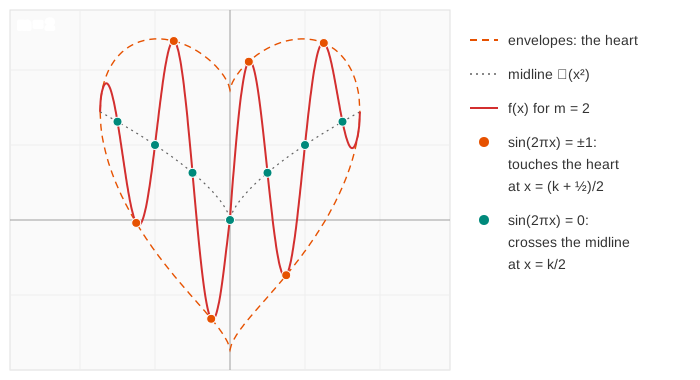
The curve touches the upper envelope where sin(mπx) = 1 and the lower one where sin(mπx) = −1, that is at x = (k + ½)/m: the upper one for even k, the lower one for odd k. There it meets the envelope at a tangent and turns back. It crosses the midline where sin(mπx) = 0, at x = k/m. (Demo: where the curve touches the heart (m = 2.5): 9 teal and 8 orange dots.)
This is the same idea as a damped wave, where a cosine swings inside a shrinking envelope ±A·e^(−γt): see Damped Oscillation: What A, γ, ω, φ Do.
What m does: the frequency
sin(mπx) repeats when mπx grows by 2π, so its period is 2/m and it makes m/2 full waves per unit of x. The domain is 2√3 long, so the number of full waves across it is
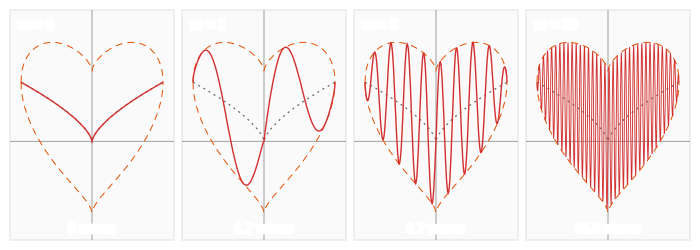
waves = 2√3 / (2/m) = m·√3 ≈ 1.73·m m = 1: 1.7 m = 6: 10.4 m = 20: 34.6 m = 50: 86.6Like b in y = a·sin(bx + c) + d (Sine Waves: What a, b, c, d Do), m squeezes the wave sideways and does not change how tall it can get: that is the envelope's job.
| m | period 2/m | waves m·√3 | midline crossings | touches |
|---|---|---|---|---|
| 1 | 2 | 1.73 | 3 | 4 |
| 2.5 | 0.8 | 4.33 | 9 | 8 |
| 6 | 0.33 | 10.39 | 21 | 20 |
| 20 | 0.1 | 34.64 | 69 | 70 |
Around m ≈ 15–20 (25–35 waves) the swings are so close together that the eye sees a filled heart rather than a curve, and at m = 50 (about 87 waves) it is solid. (Demo: play m from 0 to 20 in steps of 0.1, Demo: m = 50, about 87 waves: a solid heart.) The page draws each curve through 2000 points, about 20 per wave even at m = 50, so what you see is the real curve and not an aliasing pattern from too few samples.
m = 0: just the cusp
sin(0) = 0, so with m = 0 the whole second term disappears and f(x) = ∛(x²). Its slope (2/3)·x^(−1/3) goes to ±∞ at x = 0, so the graph has a cusp there: a sharp point that the curve keeps for every m, because the sine part is smooth and only adds to it. (Demo: m = 0 is just the cusp y = ∛(x²))
Why m starts at 0
sin is odd, sin(−θ) = −sin θ, and the other two pieces are even: ∛(x²) and √(3 − x²) do not change when x becomes −x. So f with −m at x is f with m at −x:
f_{−m}(x) = ∛(x²) − √(3 − x²)·sin(mπx) = f_m(−x)A negative m only mirrors the curve about the y-axis. Nothing new happens, so the page lets m go from 0 up. For the same reason the curve itself is not symmetric (except for m = 0), even though the heart is. Flipping a graph like this is one of the moves on Function Transformations.
Watching it fill in
Turn the trail on and the last 3 curves stay behind in light red, so you see the curve sweep through the inside of the heart as m grows. (Demo: the heart fills in (trail on, 0 → 20).) The speed choice sets how long Play takes: about 40 s, 20 s or 8 s for the 201 steps from 0 to 20.
Another way to draw a heart is in polar coordinates, the cardioid r = 1 − sin θ: see Polar Coordinates.
More curves that change shape as one parameter sweeps: The Rose Curve r = cos kθ and The Butterfly Curve, whose three terms grow an egg into wings.
What the page leaves out
Negative m (a mirror image, see above), m above 20 except in the m = 50 demo, the derivative and exact positions of the peaks (they sit a little off the touch points, because the envelope is not flat), the area of the heart, and other heart curves such as (x² + y² − 1)³ = x²y³. The window is fixed at x ∈ [−2, 2], y ∈ [−2, 2.8].