The idea: three numbers, three jobs
A quadratic function in standard form is
y = ax² + bx + c (a ≠ 0)Its graph is a parabola. Each coefficient has its own job, and each one is easiest to see at a single place on the graph: c is where the graph crosses the y-axis, b is how steep the graph is there, and a is how fast it bends away from its vertex. On the canvas the coefficients keep one colour each: a orange, b blue, c green.
c: the y-intercept
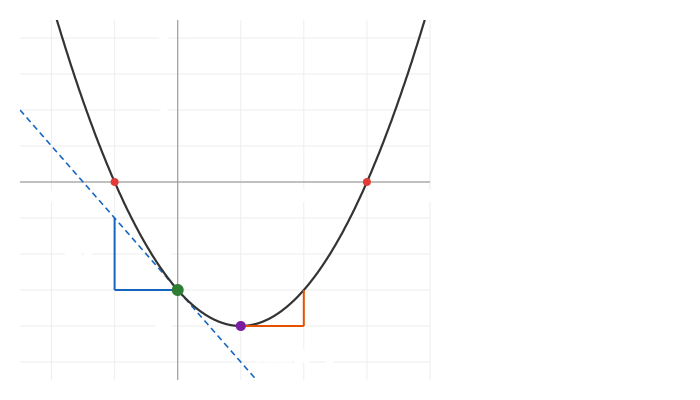
Put x = 0 into ax² + bx + c and only c is left, so the graph always crosses the y-axis at (0, c). Changing c adds the same amount to every y: the whole parabola slides straight up or down. Its shape and its axis of symmetry x = −b/2a do not change, so the vertex moves straight up or down the axis. Sliding is also how roots come and go: y = x² − 2x + c has two roots for c = −3, one double root for c = 1 (the vertex just touches the x-axis), and none for c = 3. (Demo 1: c slides it up and down)
a: which way it opens, and how wide
a is the number in front of x². Its sign says which way the parabola opens and its size says how narrow it is:
| a | opens | one step right of the vertex | looks |
|---|---|---|---|
| 2 | up | up 2 | narrow |
| 1 | up | up 1 | like x² |
| ½ | up | up ½ | wide |
| −1 | down | down 1 | x² upside down |
| 0 | no x² term: the straight line y = bx + c, not a parabola | ||
Changing a does not move the point (0, c), because the x² term is 0 at x = 0. Every parabola with the same b and c passes through it. The vertex does move, and always along the same straight line: put h = −b/2a into k = c − b²/4a and you get k = c + (b/2)·h, so the vertex stays on y = c + (b/2)x. As a shrinks toward 0 the vertex runs off along that line and the parabola flattens into the line y = bx + c. (Demo 2: a flips and narrows, Demo 5: a → 0)
b: the slope at the y-intercept
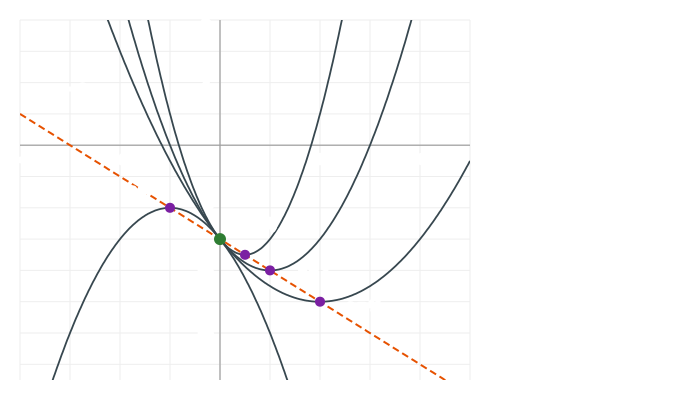
The slope of y = ax² + bx + c at any x is 2ax + b. At x = 0 that is just b: the tangent line where the graph crosses the y-axis is y = bx + c. b > 0 means the graph is going up as it crosses the y-axis, b < 0 going down, and b = 0 means it is flat there, so the vertex sits on the y-axis. (Demo 4: b is the slope at the y-intercept)
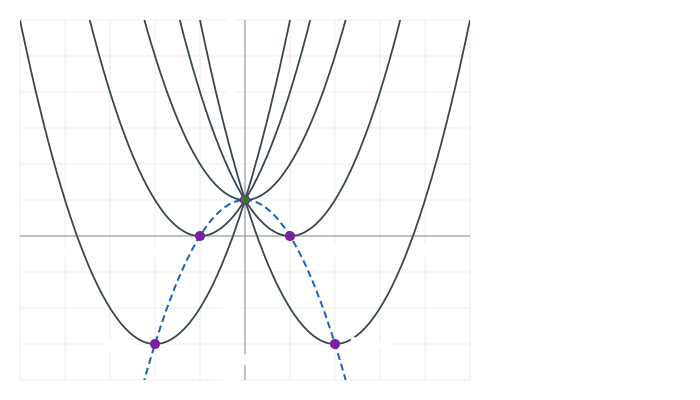
b does not change the shape. Completing the square gives a(x + b/2a)² + c − b²/4a: b only appears in where the vertex is, not in a. So changing b slides the same parabola around, and the vertex (−b/2a, c − b²/4a) traces the upside-down parabola y = −ax² + c, whose own vertex is (0, c). (Demo 3: b walks the vertex)
The vertex mixes all three
The vertex is at x = −b/2a and y = c − b²/4a; the axis of symmetry is the vertical line through it. The sign of x = −b/2a tells which side of the y-axis the vertex is on: if a and b have the same sign, the vertex is on the left; opposite signs, on the right; b = 0, on the y-axis. Here is what each change keeps and what it moves:
| change | stays the same | the vertex moves along |
|---|---|---|
| c | shape, axis | the vertical line x = −b/2a |
| a | the point (0, c) | the line y = c + (b/2)x |
| b | shape, the point (0, c) | the parabola y = −ax² + c |
Turn on trail + path to see the vertex dots land on the path for the coefficient you are changing.
Roots and the discriminant
The roots are where the graph meets the x-axis. The discriminant D = b² − 4ac counts them: D > 0 two roots, D = 0 one double root at the vertex, D < 0 none. Read it as a picture: the vertex height is c − b²/4a = −D/4a, so D > 0 exactly when the vertex is on the other side of the x-axis from where the parabola opens. For how to find the roots themselves, see Quadratic Equations.
Reading a, b and c off a graph
- a: opens up → a > 0, opens down → a < 0.
- c: where it crosses the y-axis: above the x-axis → c > 0, below → c < 0.
- b: vertex left of the y-axis → b has the same sign as a; right → the opposite sign. Or look at the slope where it crosses the y-axis: rising → b > 0.
For y = −x² − 2x + 3: it opens down (a < 0), crosses at (0, 3) (c > 0), and the vertex is at x = −1, on the left, so b has the same sign as a (b < 0). (Demo 6: read the signs)
Standard form and vertex form
Vertex form y = a(x − h)² + k shows the vertex directly and is a shift and stretch of x²; see Function Transformations. Standard form hides h and k inside b and c, but shows the y-intercept and the slope there. The two forms share a: the shape is the same number in both. The facts panel on the canvas shows both forms for the current graph.
Every parabola y = ax² + bx + c also has a focus and a directrix, at focal length p = 1/(4a) from the vertex: see Parabola: Focus, Directrix and What p, h, k Do.
What the page leaves out
Complex roots when D < 0, factored form a(x − r)(x − s), fitting a parabola through three points, cubic and higher-degree polynomials (see Cubic Functions: What a, b, c, d Do), and the derivative beyond the slope at x = 0 (see The Derivative as a Limit).