The idea: keep adding smaller, faster waves
Start with one smooth wave, cos(πx). Add a second wave that is a times as tall and b times as fast. Then a third, a times as tall and b times as fast as the second. Keep going forever:
W(x) = Σ aⁿ cos(bⁿπx) = cos(πx) + a·cos(bπx) + a²·cos(b²πx) + … 0 < a < 1, b odd, ab ≥ 1This is the Weierstrass function (1872), the first published function that is continuous everywhere but has a derivative nowhere. The page uses a = 0.5 and b = 3 to start: each wave is half as tall and three times as fast as the one before. (Demo: add terms one by one (N 0 → 12))
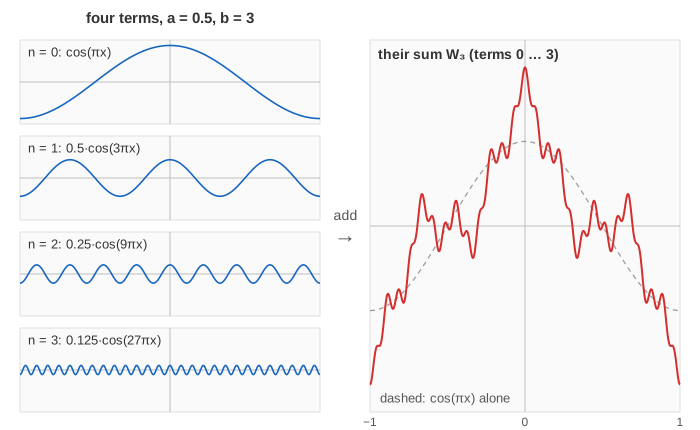
Every term is smooth, and the sum is continuous
Each term aⁿcos(bⁿπx) is a cosine, so it is smooth: it has a derivative of every order. Any partial sum W_N (terms 0 … N) is smooth too, because it is a finite sum of smooth functions. The question is what happens in the limit.
Term n is never taller than aⁿ, and the heights add up to a geometric series (Geometric Series and the Harmonic Series):
|W(x) − W_N(x)| ≤ a^(N+1) + a^(N+2) + … = a^(N+1) / (1 − a) a = 0.5, N = 12: 0.000244The bound does not depend on x, so the partial sums close in on W at the same rate everywhere. This is the Weierstrass M-test: if |fₙ(x)| ≤ Mₙ and ΣMₙ converges, then Σfₙ converges uniformly, and a uniform limit of continuous functions is continuous. So W has no jumps or holes (Limits & Continuity): a small change in x gives a small change in W.
But it has no slope anywhere
Differentiate term n and you get −π(ab)ⁿ sin(bⁿπx). If ab ≥ 1, these do not get smaller, so the derivatives cannot be added up the way the heights were. The secant slope shows what goes wrong. Take x = 0 and h = 1/bᵏ. For every term with n ≥ k, bⁿh = bⁿ⁻ᵏ is an odd number, so cos(bⁿ⁻ᵏπ) = −1 while cos(0) = 1: each of those terms drops by 2aⁿ. So
|W(h) − W(0)| / h ≥ 2·(aᵏ + aᵏ⁺¹ + …)·bᵏ = 2·(ab)ᵏ / (1 − a)With ab = 1.5 the lower bound grows by 1.5 for every zoom: the secant never settles on one slope, so there is no tangent at x = 0. On the canvas the green secant goes from x₀ to x₀ + 1/bᶻ, and the panel lists its slope at every zoom level (Demo: the secant slope at x = 0 blows up):
| zoom z | 0 | 1 | 2 | 3 | 4 | 5 |
|---|---|---|---|---|---|---|
| slope, a = 0.5, b = 3 | −4.0 | −7.5 | −11.8 | −17.9 | −26.8 | −40.2 |
| slope, a = 0.8, b = 3 | −9.5 | −23.9 | −56.8 | −134 | −312 | −721 |
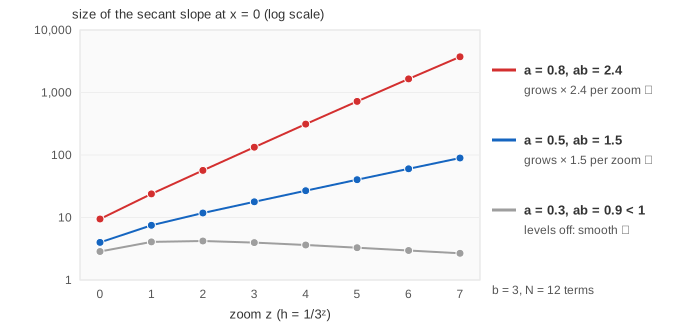
Compare a smooth curve: zoom in on it and it looks more and more like a straight line, whose slope is the derivative (Local Linearity: Zoom In Until the Curve Is a Line, The Derivative as a Limit). The Weierstrass function never straightens out, at any point. A single corner like |x| at 0 fails in one place; this fails everywhere.
Weierstrass proved it for b odd and ab > 1 + 3π/2 ≈ 5.71. In 1916 G. H. Hardy showed that 0 < a < 1 and ab ≥ 1 is enough, so the page's a = 0.5, b = 3 (ab = 1.5) passes Hardy's test but not Weierstrass' own; a = 0.9, b = 7 (ab = 6.3) passes both (Demo: Weierstrass' own condition, a = 0.9, b = 7). If ab < 1, the derivatives π(ab)ⁿ do add up and W is a smooth function.
Zoom in and it looks the same
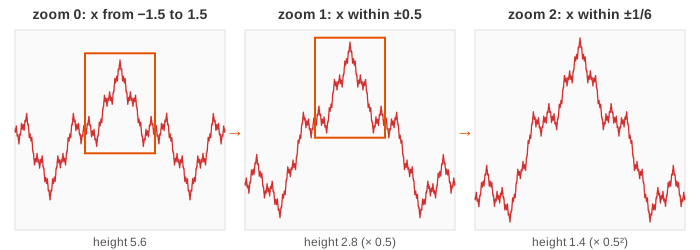
Pull out the first term and what is left is the whole function again, squeezed:
W(x) = cos(πx) + a·W(bx)a·W(bx) is W made b times narrower and a times shorter. So zoom in by b sideways and by 1/a up and down and the fine part looks just like the full picture. The first terms do not vanish: after k zooms they add a gentle bend, so the copy is similar, not identical. That is what Zoom in ×b does: the orange box is the next window, and the curve grows out of it (Demo: zoom ×3 three times at x = 0). At x = 0.5 every term is 0, since bⁿπ/2 is an odd multiple of π/2, so every wave crosses its middle there (Demo: zoom at x = 0.5, where every term is 0).
A fractal graph
Cover the graph with squares of side δ = 1/bᵏ. In each column of width δ the curve swings up and down by about aᵏ, so it needs about aᵏ/δ = (ab)ᵏ squares, and there are bᵏ columns: about (ab²)ᵏ squares in all. The box dimension is the power of 1/δ that this count grows like:
dimension = log(ab²) / log b = 2 + log a / log b| a | 0.5 | 0.6 | 0.7 | 0.8 | 0.9 |
|---|---|---|---|---|---|
| b = 3 | 1.369 | 1.535 | 1.675 | 1.797 | 1.904 |
| b = 7 | 1.644 | 1.737 | 1.817 | 1.885 | 1.946 |
A smooth curve has dimension 1 and a filled area has dimension 2. The Weierstrass graph is in between: a fractal. Bigger a keeps the small wiggles tall, so the graph gets rougher and closer to filling an area (Demo: a = 0.5 vs a = 0.8, zoomed in twice). That the Hausdorff dimension has the same value was proved only in 2018, by Weixiao Shen. Another picture with new detail at every scale is the bifurcation diagram of The Logistic Map: from a Fixed Point to Chaos.
What a screen can draw
A computer can only add finitely many terms, and a wave whose period is shorter than a pixel cannot be drawn as a line. With b = 3, term 12 has period 2/3¹² ≈ 0.0000038. The page draws each curve through 2800 points and draws term n as a line only if one period spans at least 5 points: at zoom 0 that is n ≤ 5 for b = 3 and n ≤ 3 for b = 5 or 7, and each zoom adds one. The finer terms are not dropped silently: their total height T is drawn as the light red band ±T, and the true W_N stays inside it. Zoom in and they turn into lines one by one.
Twelve terms is plenty for a = 0.5 (what is left is under 0.0003), but not for a = 0.9: the missing terms still add up to 0.9¹³/0.1 ≈ 2.5 out of a total height of 10. And with only a few terms the zoom eventually finds a smooth curve, because a partial sum is smooth (Demo: only 3 terms: zooming finds a smooth curve): the secant slopes stop growing and fall toward W₃′(0) = 0. Only the infinite sum stays rough at every scale.
A "monster" in 1872
Until the 19th century most mathematicians took for granted that a continuous function has a slope at most points. Weierstrass presented his example to the Berlin Academy in 1872 (published by du Bois-Reymond in 1875). Poincaré called such functions monsters, and Hermite wrote that he turned away "with fright and horror" from them. They turned out to be normal: Banach showed in 1931 that, in a precise sense, most continuous functions are differentiable nowhere, and the path of a particle in Brownian motion is one. W is also a Fourier series with only the frequencies 1, b, b², … (Fourier Series, Harmonic by Harmonic): its coefficients aⁿ shrink too slowly, compared with the frequencies, for the sum to be smooth.
What the page leaves out
The proof for a general point x (the page only works out x = 0), a < 1/b where W is smooth, non-integer b, the sine version Σ aⁿ sin(bⁿx), the Takagi (blancmange) curve built from triangle waves, Hölder continuity (|W(x) − W(y)| ≤ C|x − y|^α with α = −log a / log b), the Hausdorff dimension proof, and Brownian motion. The page stops at N = 12 terms and 7 zooms.