The idea: zoom in and a smooth curve becomes a line
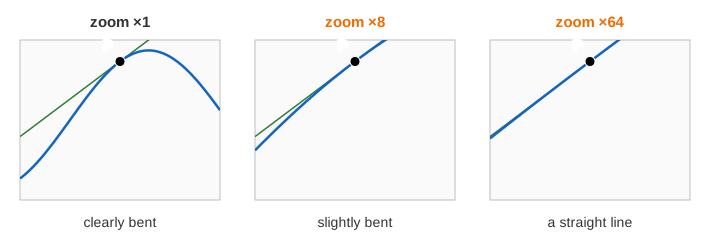
Pick a point P on the graph of a smooth function and zoom in on it, again and again. The bend gets smaller at every zoom until the piece of curve in the window is, to the eye, a straight line. This is local linearity. The line it turns into is the tangent, and its slope is the derivative f′(x). On the canvas the orange box on the left is the zoom window; the right plot shows only what is inside it.
How fast the curve straightens
The table measures the straightness. For a window x ± w it gives the slope from P to the left edge, (f(x) − f(x − w)) / w, and to the right edge, (f(x + w) − f(x)) / w. On a line the two are equal. For x² at x = 1 the algebra is exact: the left slope is 2 − w and the right slope is 2 + w, so right − left = 2w. Each ×2 zoom halves w and halves the difference. (Demo: zoom into x² at x = 1)
| zoom | window ± w | left slope | right slope | right − left |
|---|---|---|---|---|
| ×2 | 1 | 1 | 3 | 2 |
| ×4 | 0.5 | 1.5 | 2.5 | 1 |
| ×16 | 0.125 | 1.875 | 2.125 | 0.25 |
| ×64 | 0.03125 | 1.96875 | 2.03125 | 0.0625 |
Any smooth f behaves the same way: right − left ≈ f″(x)·w, so the bend you can see falls in proportion to the window. sin x at 1 with ×10 zooms gives slopes 0.54030… on both sides after a few steps. (Demo: zoom ×10 into sin x)
A corner never straightens
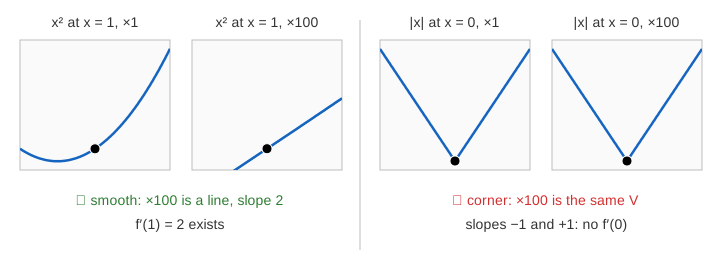
Zoom into |x| at 0 and nothing changes. The graph is made of two straight half-lines, so scaling it about the corner gives the same V: left slope −1 and right slope +1 at ×2, ×100 or ×10⁶. There is no single line to turn into, so f′(0) does not exist. A cusp, such as x2/3 at 0, is worse: zooming makes it sharper, its sides turn vertical. (Demo: zoom into the corner of |x|)
Linear approximation and the differential
If the curve near P is almost a line, use the line. Near x the function is approximated by its tangent, the linearization
f(x + dx) ≈ f(x) + f′(x)·dx, or in differentials, dy ≈ f′(x)·dx.
Example: √4.1. With f(x) = √x, x = 4 and dx = 0.1, f′(4) = 1/(2√4) = 1/4, so dy = 0.1/4 = 0.025 and √4.1 ≈ 2 + 0.025 = 2.025. The true value is 2.0248457…, an error of 0.00015. (Demo: √4.1 ≈ 2.025)
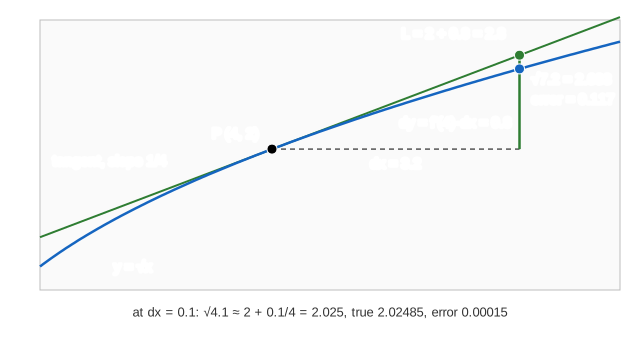
The error shrinks like dx²: halve dx and it falls about four times. That is because the curve leaves its tangent only through the bend, ½·f″(x)·dx². For x² the error is exactly dx². (Demo: x² at 1)
| dx | L = 2 + dx/4 | true √(4 + dx) | error | error ratio |
|---|---|---|---|---|
| 3.2 | 2.8 | 2.683282 | 0.1167 | |
| 1.6 | 2.4 | 2.366432 | 0.03357 | ÷ 3.48 |
| 0.8 | 2.2 | 2.190890 | 0.009110 | ÷ 3.68 |
| 0.4 | 2.1 | 2.097618 | 0.002382 | ÷ 3.82 |
| 0.2 | 2.05 | 2.049390 | 0.0006098 | ÷ 3.91 |
| 0.1 | 2.025 | 2.024846 | 0.0001543 | ÷ 3.95 |
Compared with dx the error vanishes: error / dx → 0. That is exactly what "f is differentiable at x" means, and why, in the zoomed window, the gap between L and the true point keeps getting smaller even though dx fills the same width every time.
Where it is used
- Newton's method replaces f by its tangent line and solves the line.
- Euler's method steps along the tangent: y(t + h) ≈ y(t) + y′(t)·h.
- Error propagation: a measurement error dx in x causes about f′(x)·dx in f(x).
- Small angles: sin θ ≈ θ near 0, the tangent of sin at 0.
- Taylor series add the bend (f″, f‴, …) to the line for a better fit.
See also the derivative as a limit (secants turning into the tangent), limits, reading f′ from the graph of f, the Mean Value Theorem and the chain rule.
For a curve that never straightens out however far you zoom, see The Weierstrass Function: Continuous Everywhere, Differentiable Nowhere.
What the page leaves out
The page zooms both axes by the same factor about P; zooming only one axis is not shown. The exact derivatives come from the known formulas. Cusps and vertical tangents are described, not animated. Functions of several variables (the tangent plane, total differential dz ≈ fx·dx + fy·dy) and quadratic approximation beyond the line are not covered.