The idea: measure an area by throwing darts
A Monte Carlo method answers a question about numbers by running a random experiment many times. Here the question is "what is π?". Throw points at random into the unit square (side 1, area 1). The quarter circle of radius 1 in its corner has area π/4 ≈ 0.785, so a random point lands inside it with probability π/4. Count the share of points inside and multiply by 4.
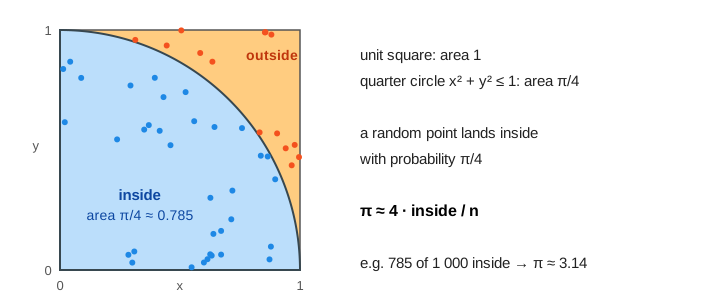
On the canvas, blue dots are inside (x² + y² ≤ 1) and orange dots are outside. The counts panel shows n, the two counts and the estimate; the chart plots the estimate after every point against n.
One point is one yes/no test
Each point needs two random numbers, x and y, each uniform in [0, 1). The point is inside when x² + y² ≤ 1, which is Pythagoras: its distance from the corner (0, 0) is at most 1. No π and no square root are needed for the test. The black line on the canvas is that distance. (Demo 1: 10 points, one at a time: 7 of the first 10 points are inside, so π ≈ 4 · 7 / 10 = 2.8.)
With few points the estimate can only take a few values: after 10 points it is 0, 0.4, 0.8, … , 4.0. More points make the steps finer and the estimate steadier. (Demo 2: 1 000 points in batches of 100 ends at 797 inside, π ≈ 3.188.)
How big is the error?
The count of inside points is a sum of n coin flips that come up "inside" with probability p = π/4. Its share has standard deviation √(p(1 − p) / n), and the estimate is 4 times that share, so its typical error is
About 95% of runs end inside π ± 2σ: the orange funnel on the chart. The funnel narrows like 1/√n.
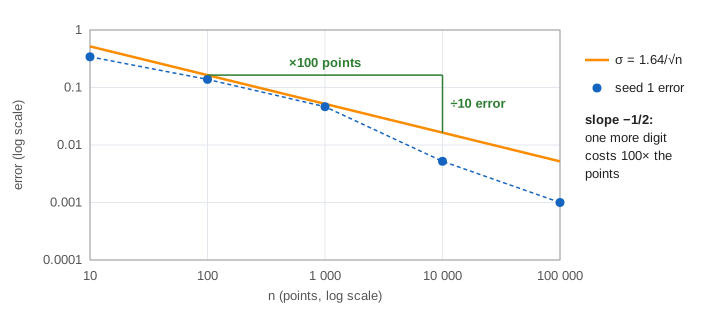
| n | π estimate (seed 1) | error | typical error 1.64/√n |
|---|---|---|---|
| 10 | 2.8000 | 0.342 | 0.519 |
| 100 | 3.2800 | 0.138 | 0.164 |
| 1 000 | 3.1880 | 0.0464 | 0.0519 |
| 10 000 | 3.1364 | 0.0052 | 0.0164 |
| 100 000 | 3.1426 | 0.0010 | 0.0052 |
So 100× more points buy about one more correct digit. A million points give about 3 digits (3.14); ten digits would need around 1020 points. Monte Carlo is a terrible way to compute π, but the same 1/√n rule holds for every Monte Carlo estimate, and that is what makes the method useful elsewhere. (Demo 3: convergence to 100 000 points fills the table above.)
Seeds: random, but repeatable
Computers make pseudo-random numbers: a fixed rule (here mulberry32) turns a starting number, the seed, into a stream that looks random. The same seed always gives the same points, which makes runs repeatable and lets this page undo a step. A different seed is a different experiment: seed 1 reaches 3.1364 at n = 10 000, seed 2 reaches 3.1688. Both paths stay inside the funnel, and at one n either one can be the luckier. (Demo 4: a different seed keeps seed 1's line in grey.)
Monte Carlo integration
The same darts measure any area. To get ∫₀¹ x² dx, the area under y = x², throw points into the unit square and count a hit when y < x². The share of hits, times the box area (1), estimates the integral, whose true value is 1/3. This is hit-or-miss Monte Carlo. (Demo 5: Monte Carlo integral of x²: 0.3338 after 10 000 points.)
A better version, the mean-value estimate, skips y: draw x at random and average f(x). ∫ f ≈ (b − a) · (f(x1) + … + f(xn)) / n. It has a smaller σ but the same 1/√n rate.
| Method | Error with n samples | In d dimensions |
|---|---|---|
| Riemann sum / midpoint rule | 1/n² (smooth f) | 1/n2/d: gets worse fast |
| Monte Carlo | 1/√n | 1/√n in any dimension |
In one dimension a Riemann sum wins easily. In 10 or 100 dimensions a grid needs far too many points, while Monte Carlo's error still falls like 1/√n. That is why physics, finance (option pricing) and film rendering use it.
Where the same idea shows up
Monte Carlo Tree Search judges a game move by the share of random playouts it wins, exactly like the share of points inside the circle. Simulated Annealing uses random moves accepted with probability eΔ/T (the Metropolis rule, from the same Los Alamos group that named Monte Carlo). The name comes from Stanisław Ulam and John von Neumann in the 1940s, after the Monte Carlo casino.
The birthday paradox checks an exact probability curve against seeded simulated rooms the same way.
See also the Monty Hall problem, where 100 and 1000 seeded games estimate the 2/3 switching win rate the same way.
Reservoir sampling shows how to draw a uniform sample from a stream you see only once.
Random points can also draw a fixed shape: in The Chaos Game seeded random jumps always draw the Sierpinski triangle.
What the page leaves out
Variance reduction (importance sampling, stratified sampling, antithetic and control variates), quasi-Monte Carlo with low-discrepancy sequences (error close to 1/n), Markov chain Monte Carlo, confidence intervals from the sample variance, and how pseudo-random generators are tested. The canvas draws only the first 1 000 points; the counts go on to 100 000.