The idea: an integral is a signed area
The definite integral ∫ab f(x) dx is the area between the curve y = f(x) and the x-axis, from x = a to x = b. Area above the axis counts as positive and area below counts as negative, so it is a signed area. A curved region is hard to measure, but rectangles are easy. A Riemann sum cuts [a, b] into n strips of equal width Δx = (b − a)/n, gives each strip one height, and adds height × Δx. The more strips, the closer the sum gets to the integral.
Four ways to fill a strip
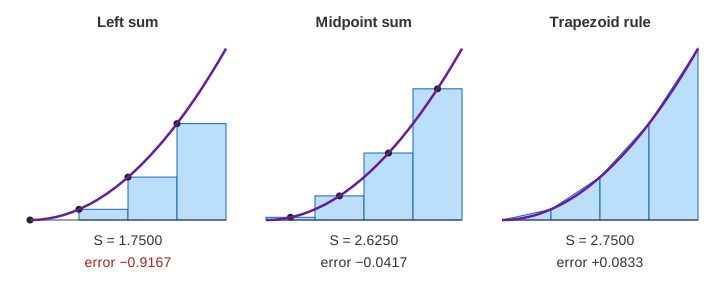
Strip i runs from xi−1 to xi = a + iΔx. The methods differ only in the height they use (the black sample point on the canvas):
| Method | Height of strip i | x² on [0, 2], n = 4 |
|---|---|---|
| Left sum | f(xi−1) | 1.7500 (error −0.9167) |
| Right sum | f(xi) | 3.7500 (error +1.0833) |
| Midpoint sum | f((xi−1 + xi)/2) | 2.6250 (error −0.0417) |
| Trapezoid rule | (f(xi−1) + f(xi))/2 | 2.7500 (error +0.0833) |
The exact value is ∫02 x² dx = 8/3 ≈ 2.6667. The trapezoid rule is the average of the left and right sums: (1.75 + 3.75)/2 = 2.75. Press Draw to build a sum strip by strip with a running total, then Double n to fill the next row of the table. (Demo: x² on [0, 2], midpoint, n = 4 → 32)
Left vs right for an increasing function
x² goes up on [0, 2]. The left end of each strip is its lowest point, so every left rectangle sits under the curve and the left sum is too small. The right end is the highest point, so every right rectangle pokes above the curve and the right sum is too big. The exact area is always between them. For a decreasing function the two swap places. (Demo: left vs right (increasing x²))
How fast the error shrinks
The table's ÷ line says how many times smaller the error got when n doubled. For the left and right sums it is about 2: the error is proportional to 1/n. For the midpoint and trapezoid rules it is 4: the error is proportional to 1/n². With 32 strips the midpoint sum is already closer than the left sum would be with about 6,000.
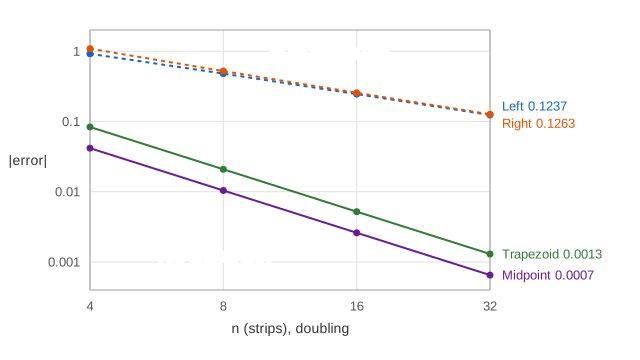
For x², which curves upward (it is convex), the trapezoid's straight top lies above the curve, so the trapezoid rule over-estimates. The midpoint rectangle loses a little on one side of the middle and gains less on the other, so it under-estimates, by exactly half as much: on x² the midpoint error is −Δx²/6 and the trapezoid error is +Δx²/3. That ratio of about −½ holds for any smooth function when n is large, which is why Simpson's rule takes (2·Midpoint + Trapezoid)/3 to cancel both errors. (Demo: midpoint vs trapezoid error)
One hump of sin x
∫0π sin x dx = 2. Here the left sum, the right sum and the trapezoid rule give the same number (1.8961 at n = 4): the left and right sums differ only in the first and last heights, sin 0 and sin π, and both are 0. The midpoint sum gives 2.0523, again about half the error on the other side. (Demo: sin x on [0, π] = 2)
Area below the axis subtracts
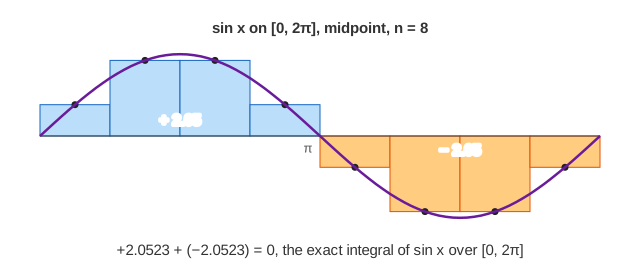
On [π, 2π] sin x is negative, so its strips have negative heights and subtract from the sum. The canvas shades them orange. The two halves are mirror images, so every sum on [0, 2π] comes out 0, exactly the integral ∫02π sin x dx = 0. A zero integral does not mean there is no area; it means the positive and negative parts cancel. The total unsigned area is ∫|sin x| dx = 4. (Demo: signed area, sin x on [0, 2π] = 0)
From sums to the integral
A function is Riemann integrable when every way of picking the sample points gives sums that approach the same number as the strips get thinner; that number is the integral. Every continuous function on [a, b] is integrable. The fundamental theorem of calculus then gives the exact value without any sum: if F′ = f, the integral is F(b) − F(a), for example x³/3 from 0 to 2 is 8/3. Differentiation is the reverse limit, rise over run as the run shrinks: see the derivative as a limit. When the region is too complicated for strips, random points estimate the area instead: see Monte Carlo estimation of π.
The exact value without any sum: the area function and F(b) − F(a) on the Fundamental Theorem of Calculus.
Why add up f·Δx at all? Accumulation shows each strip as an amount (litres or metres) building up over time.
When the interval is infinite or f blows up at an end, the integral becomes a limit of these sums: see Improper Integrals.
The integral is a limit of these sums; what "limit" means exactly (ε and δ) is shown in Limits & Continuity.
The same sums add up volumes too: thin disks π f(x)² Δx and shells 2π x h(x) Δx on Volumes by Slicing.
The trapezoid rule against Simpson's parabolas, side by side on the same curve with a log-log error chart: Numerical Integration: Riemann vs Trapezoid vs Simpson.
What the page leaves out
Strips of unequal width and sample points chosen anywhere in the strip (the general Riemann sum), Simpson's rule and Gaussian quadrature, adaptive methods that put more strips where the curve bends most, functions with jumps or infinite values, and floating-point rounding when n is very large.